Meny
6. What was reported?
To be reportable, an incident must meet these three criteria:
- * death or severe harm to patient or user
- as a result of the provision of health and care services or the patient or user harming another patient or user AND
- the outcome is unexpected based on foreseeable risk.
There is no reporting duty for incidents that could potentially have resulted in death or severe harm.
While the scope of what falls within and outside the reporting scheme may be discretionary, we assess all reports in relation to these criteria. As Figure 1 shows, we concluded that 652 reports (40 per cent) did not meet the reporting criteria. These are discussed in more detail in Chapter 5.4.
All reports are considered from an interdisciplinary perspective and are categorised according to incident type and severity of harm to the patient/user before we draw a conclusion on the action to be taken. In the following, we present incidents within the municipal health and care services that fell within the reporting scheme criteria.
6.1. Incident types
The incident descriptions in the reports generally provide a description of what happened, and we have relatively little information about risk factors and improvement potentials. Incidents are categorised based on what we believe was the main concern or issue reported. We select one incident type per incident. However, any given incident may involve multiple factors or issues. An overview of incident types is provided in Table 3. A description and examples of what the incident types involve are presented in Appendix 1.
|
INCIDENT TYPES |
Percentage |
Number |
|---|---|---|
|
Medical examination/diagnostics |
16.8 |
147 |
|
Fall |
13.3 |
116 |
|
Unknown/undetermined cause of death |
12.0 |
105 |
|
Medication use |
9.3 |
81 |
|
Suicide |
8.4 |
73 |
|
Acute life-saving intervention |
5.4 |
47 |
|
Medical care |
5.4 |
47 |
|
Physical assault |
5.0 |
44 |
|
Infection |
3.3 |
29 |
|
Other |
2.4 |
21 |
|
Use of medical devices |
2.3 |
20 |
|
Burns/scalds |
2.2 |
19 |
|
Complaint regarding service/rights/treatment offered |
2.1 |
18 |
|
Overdose/intox |
2.1 |
18 |
|
Complication related to feeding/ingestion |
1.7 |
15 |
|
Suicide attempt/self-inflicted harm |
1.6 |
14 |
|
Nursing, personal care or observation |
1.4 |
12 |
|
Disappearance/abscondment |
1.3 |
11 |
|
Homicide |
1.0 |
9 |
|
Suspected/alleged sexual assault by employee |
0.8 |
7 |
|
Surgical intervention/operation |
0.7 |
6 |
|
Patient/home care safety alarm |
0.7 |
6 |
|
Fall/jump from height |
0.5 |
5 |
|
Use of force (physical, mechanical or chemical restraint) |
0.3 |
3 |
|
Total |
100 |
873 |
6.2. Where in the health and care services did the incident occur?
Unwanted serious patient incidents often occur in a setting where more than one healthcare agency is involved. Therefore, when classifying where the incident occurred, we apply more than one value. Thus, the sum of the numbers in Table 4 exceeds the total number of incidents. Here we see that the majority of incidents involved nursing homes or other institutions, home-based health and care services, local out-of-hours medical centre/EMS communications centres and general practitioner services. Some of the options in this classification system are specialist health care. These are incidents where both the specialist health service and the municipal health and care service were involved.
|
CARE SETTING |
Number |
|---|---|
|
Nursing home or other institution (not municipal/emergency in-patient care) |
310 |
|
Home-based health/care services (not practical assistance) |
180 |
|
Local out-of-hours medical centre/EMS communications centres |
152 |
|
General practitioner services (not out-of-hours medical centre) |
131 |
|
Other municipal health and care service |
100 |
|
Health trust |
55 |
|
Habilitation/rehabilitation |
47 |
|
Practical assistance |
19 |
|
Other |
15 |
|
Municipal/emergency in-patient care |
14 |
|
Municipal mental health/SUD service |
13 |
|
Maternity and child healthcare centre |
4 |
|
Private hospital or unit in private specialist health services |
3 |
|
Private practice specialist |
3 |
|
Prisons health service |
3 |
|
Other 1st line private health service |
2 |
|
Public health service/environmental health service |
1 |
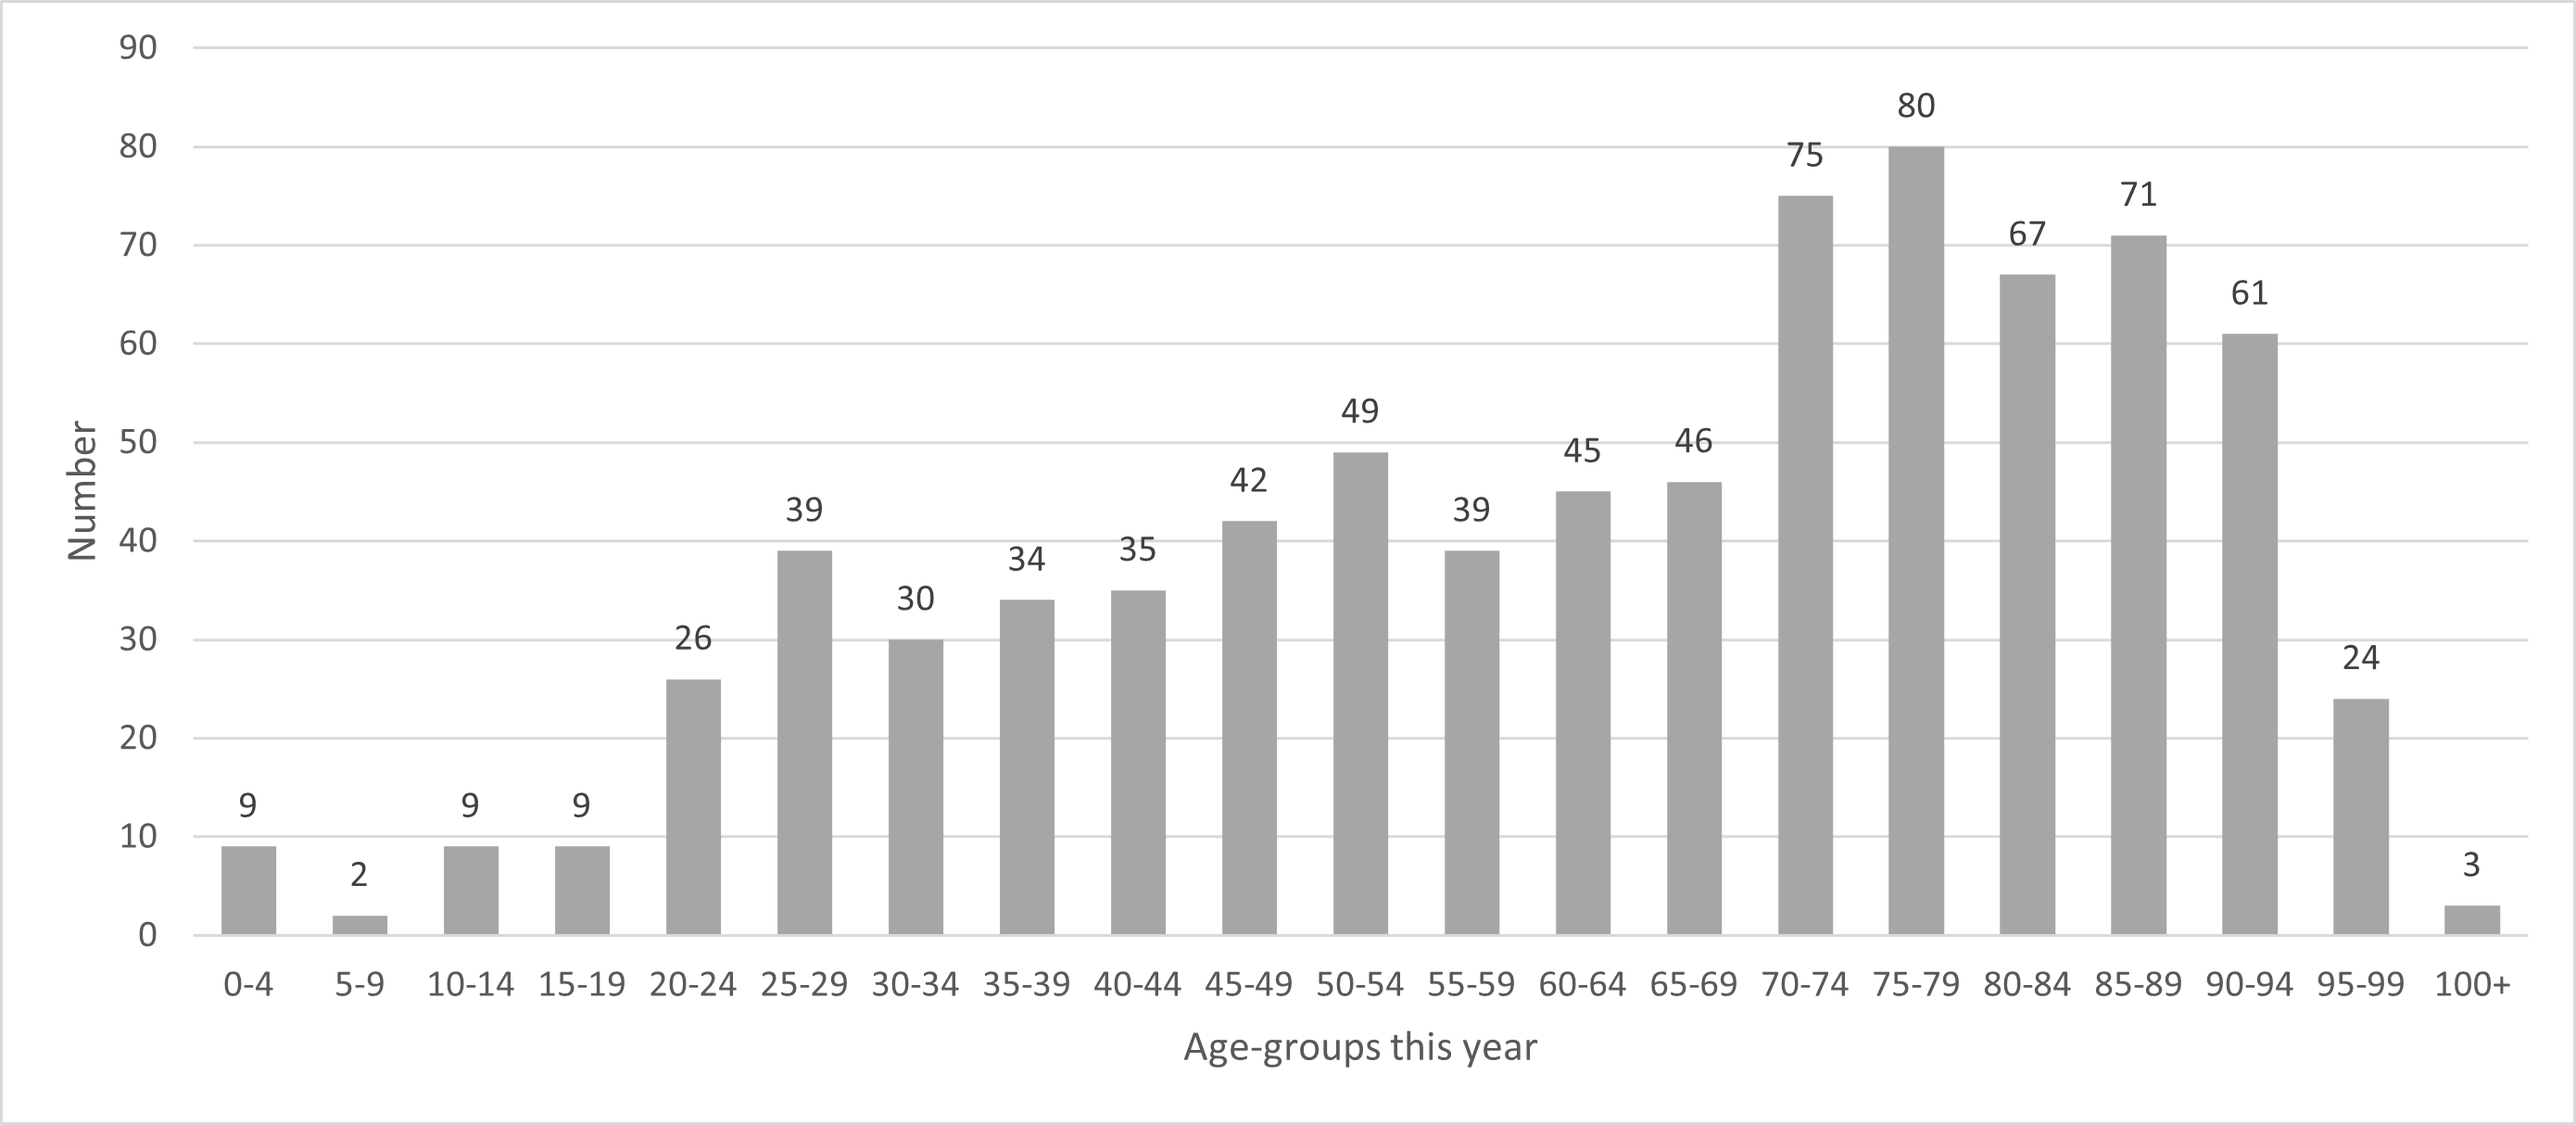
6.3. Age distribution
The age distribution among patients/users in the 873 incidents is shown in Figure 2 and Table 5. Here we see that the majority of reports concerned individuals aged 65+; 427 concerned individuals aged 65+ (49 per cent). We lack age data in 78 of the reports. This is because age data was not systematically recorded before we started using digital reports.
Figure 2: Age distribution of patients/users across the incident reports received
|
AGE GROUP |
Number |
|---|---|
|
0-4 years |
9 |
|
5-9 years |
2 |
|
10-14 years |
9 |
|
15-19 years |
9 |
|
20-24 years |
26 |
|
25-29 years |
39 |
|
30-34 years |
30 |
|
35-39 years |
34 |
|
40-44 years |
35 |
|
45-49 years |
42 |
|
50-54 years |
49 |
|
55-59 years |
39 |
|
60-64 years |
45 |
|
65-69 years |
46 |
|
70-74 years |
75 |
|
75-79 years |
80 |
|
80-84 years |
67 |
|
85-89 years |
71 |
|
90-94 years |
61 |
|
95-99 years |
24 |
|
99 years+ |
3 |
|
Missing age data |
78 |
|
Total |
873 |
6.4. Gender distribution
For the 873 incidents reported, gender data was missing in 78 cases.. Of the remaining 795, 377 were women/girls (47 per cent) and 418 were men/boys (53 per cent).
6.5. Degree of harm to patient/user
By degree of harm, we mean the severity of the adverse effect or actual impact on a patient/user caused by a given incident. What constitutes Severe harm is a matter of discretionary judgement.
For the majority of incidents, we have no information about how the patient’s condition progressed after we received information about the incident. This is why the degree of harm is graded as Uncertain/other in around one-fifth of the incidents.
The degree of harm is shown in Table 6.
|
DEGREE OF HARM IMPACTING/CAUSED BY PATIENT/USER |
Percentage |
Number |
|---|---|---|
|
Death |
60.6 |
529 |
|
Severe harm |
15.1 |
147 |
|
Death of someone else caused by patient/user |
0.6 |
5 |
|
Severe harm caused to someone else by patient/user |
1.4 |
12 |
|
Uncertain/other |
20.6 |
180 |
|
Total |
100 |
873 |
In incidents reported by organisations, the proportion of deaths was somewhat higher than in those reported by individuals (66 versus 41 per cent).